GC Case Study: Healthy Churn with SurvivorDemoAgent
The leak-to-OOM case study has one honest gap: LeakyAgent's 2MB strings are
humongous objects (see GC Basics §6)
— they're allocated directly into their own dedicated regions and never touch Eden or Survivor at
all. That means the leak demo never actually shows the Eden → Survivor → Old promotion
cycle from the basics page happening for real.
This page fixes that gap with a second agent, SurvivorDemoAgent, that does normal small-object
churn instead of leaking — and, unlike the leak, it runs forever without crashing.
1. The agent
New to Agrona's Agent/AgentRunner/IdleStrategy pattern? Read
Agrona's Agent Pattern, Explained first — this page assumes it.
The design, and why each choice matters:
- 2KB objects — small enough that every single one goes through the normal Eden→Survivor→Old lifecycle. Nothing here ever becomes humongous.
- A bounded sliding window (
ArrayDequecapped at 5,000 entries) instead of an ever-growing list. New objects push in at the tail; once the window is full, the oldest object at the head is dropped and becomes garbage. This mimics a real, common pattern — an LRU cache, a recent-events buffer, a rolling metrics window — where the live set size stays roughly constant even though allocation never stops. That single difference fromLeakyAgent(bounded vs. unbounded retention) is what separates "healthy churn" from "leak." - Paced at 50 objects / 5ms — 50 × 2KB = 100KB per tick, 200 ticks/sec, so ~20MB/sec
sustained allocation. Fast enough to trigger frequent young collections within seconds, not
minutes, but throttled (via the same
nextFireNsself-timing pattern as the other agents) so it doesn't peg a CPU core doing nothing but allocate.
Wired into Main.java (renamed from DirectBufferExplore.java) the same way as the other agents
— its own AgentRunner, started on an explicit daemon thread.
Reproducing this exact run
Main.java keeps every demo agent as its own commented-out AgentRunner block. To reproduce
this run, make sure the SurvivorDemoAgent/survivorRunner block is uncommented and the
LeakyAgent block is commented out — running both at once works, but makes the GC log harder
to read cleanly since both workloads mix together.
2. What the console log shows
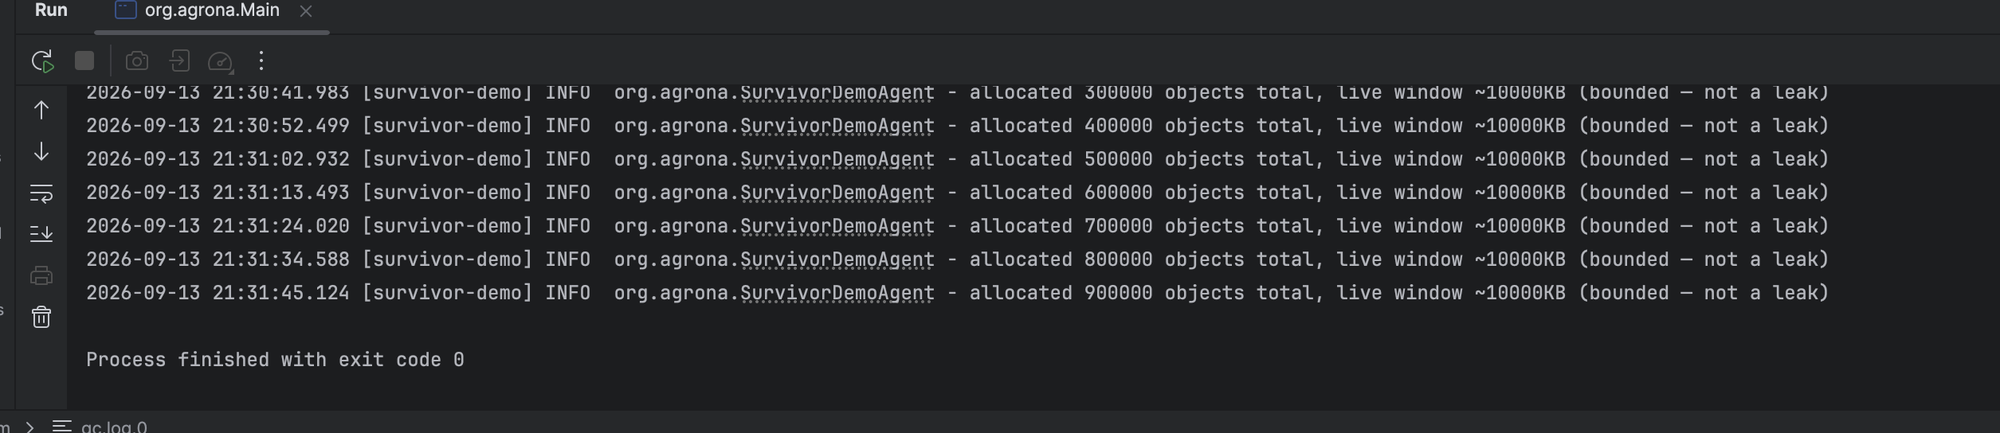
live window ~10000KB stays exactly constant — 5,000 × 2KB — across 900,000 total allocations.
That's the proof the window is doing its job: memory pressure comes from allocation rate, not
from an ever-growing retained set. And notice the last line: Process finished with exit code
0 — no crash. This agent can run indefinitely.
3. What VisualVM's Monitor tab shows — a completely different shape
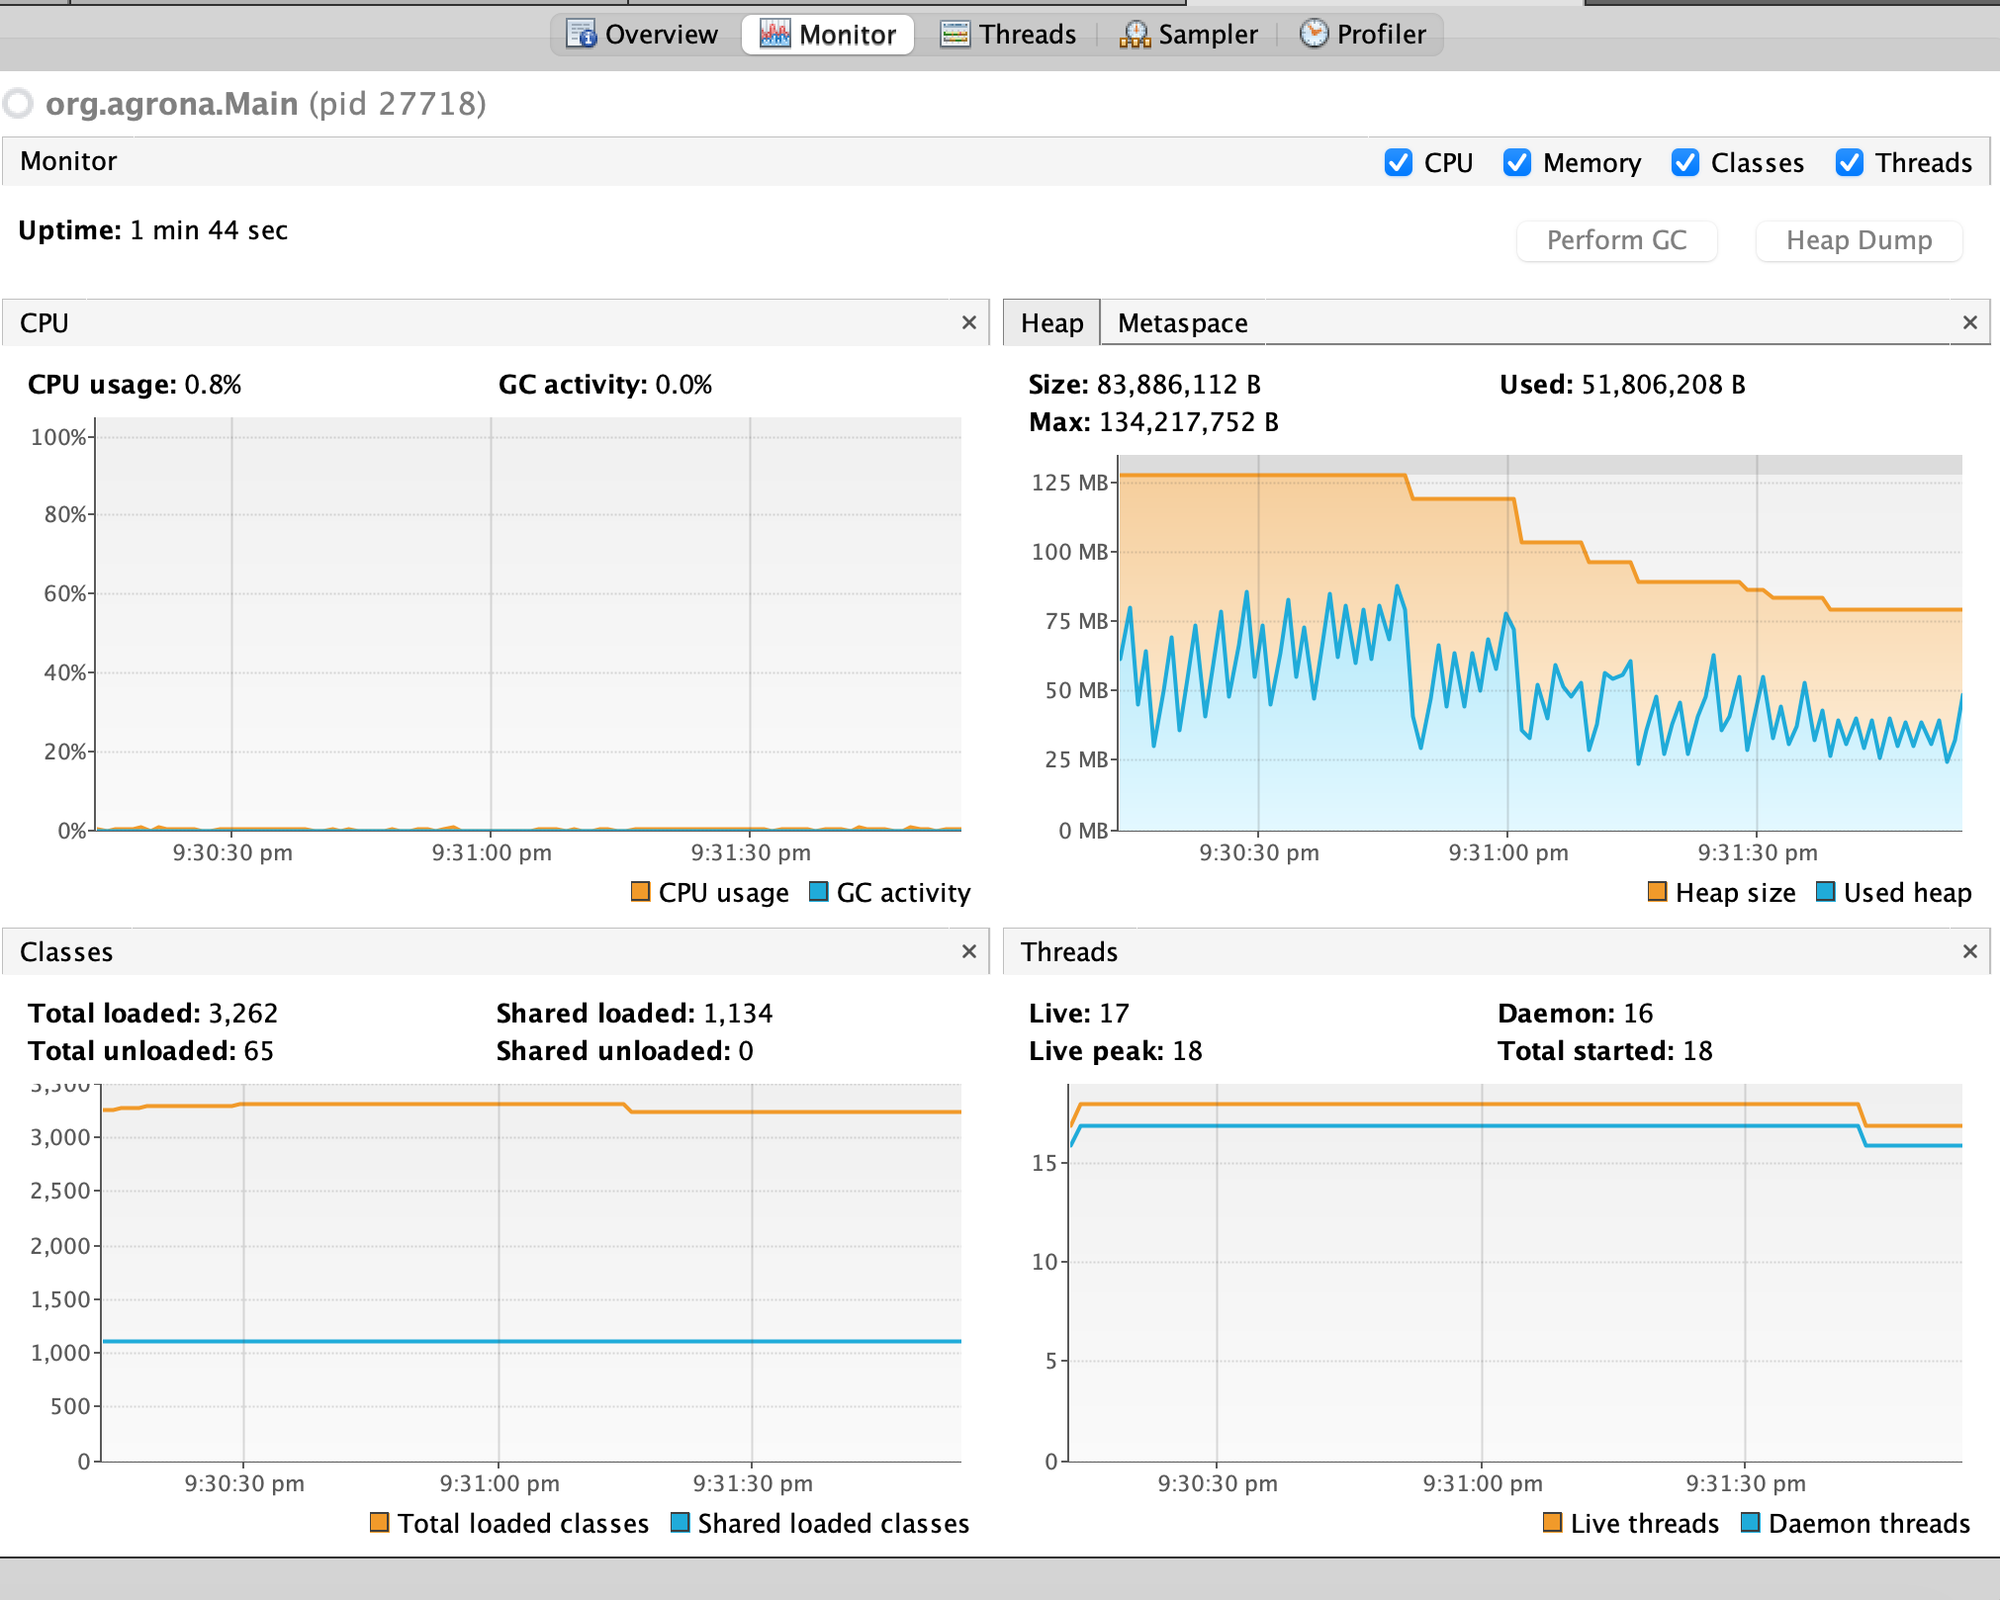
Compare this directly to the leak's heap graph:
LeakyAgent |
SurvivorDemoAgent |
|
|---|---|---|
| Used heap shape | Staircase, monotonically up | Rapid sawtooth, oscillating |
| Heap size (committed) | Stays near max, one late drop | Steps down repeatedly as usage stabilizes lower |
| Ends in | OutOfMemoryError |
Runs forever, clean exit |
The sawtooth here is visible on the graph itself — proof that minor GCs are firing frequently
and actually reclaiming real memory each time, unlike the leak where nothing was ever reclaimed.
The Heap size line stepping down (128MB → ~58MB) is the same G1 elastic-commit behavior
discussed in the leak case study, but here it's driven by G1 correctly recognizing that a stable,
bounded live set doesn't need as much committed memory over time — not by a single post-GC
resize decision.
4. What the GC log proves — the full lifecycle, actually happening
This is the part neither screenshot can show: real Survivor-space activity and real Old-gen promotion and reclaim.
Survivor regions actually flip and vary
Real, continuous change — not the flat, unchanging counts LeakyAgent's log showed (since its
objects never touched Survivor at all).
Old regions rise AND fall — real promotion, real reclaim
LeakyAgent's Humongous region count only ever climbed, forever, because nothing it retained
ever became garbage. Here, Old gen genuinely goes up (objects surviving long enough to be
promoted) and down (those same objects eventually aging out of the sliding window, becoming
unreachable, and actually getting reclaimed).
G1's mixed-collection machinery is running — because there's finally something to reclaim
86 Prepare Mixed + Mixed pauses combined — these are collections that scan old gen regions
looking for reclaimable garbage, and find some. LeakyAgent's log never produced a single one of
these, because there was never anything reclaimable in old gen to justify one. Their presence
here is direct, log-level proof that this workload is healthy: memory that gets promoted
eventually gets reclaimed, exactly as the generational hypothesis
predicts.
Also worth noting: Humongous regions: 0->0 on every single line of this log — confirming none
of these 2KB objects ever bypassed the normal lifecycle.
5. The takeaway
Two agents, two completely different signatures, both readable from the same three tools:
| Signal | LeakyAgent (leak) |
SurvivorDemoAgent (healthy) |
|---|---|---|
| Object size | 2MB (humongous) | 2KB (normal) |
| Retention | Unbounded (never released) | Bounded sliding window |
| Survivor activity | None — bypassed entirely | Constant flux |
| Old gen trend | Only ever grows | Rises and falls |
| Mixed GCs | Never happen | Frequent |
| VisualVM heap shape | Staircase climbing to the ceiling | Sawtooth, stable band |
| Outcome | OutOfMemoryError |
Runs indefinitely |
If you only ever watch a heap graph shaped like a staircase climbing toward the max, that's already a strong, early, visual signal of a leak — long before the log-level proof (ever-growing Humongous/Old region counts, or an eventual OOM) confirms it.
6. Practical rule: where should a List field actually live?
Both agents' List/Deque fields are declared at the class level — so what actually decides
whether that shape is LeakyAgent or SurvivorDemoAgent isn't where the field is declared, it's
whether it has a bounded lifecycle.
Default to a method-level (local) variable whenever you can. A list created inside a method is reachable only for that call — once the method returns, it's immediately garbage, dies young in Eden, and never becomes anyone's problem. This is the right choice for scratch space: build up results, process them, return.
Only promote it to a class-level field when the data genuinely must outlive a single method call — and the moment you do, you've taken on the responsibility of bounding it:
- Unbounded
.add(), nothing ever removed →LeakyAgent's shape. Grows forever regardless of how small each element is, eventually lands in Old gen and never leaves. - Bounded — a fixed-size sliding window, an explicit
clear(), TTL eviction, a real cache with an eviction policy — →SurvivorDemoAgent's shape. Same "class-level field," but the live set stays flat no matter how many times it's called.
Instance field vs static field — different blast radius
An instance field's lifetime is tied to the object holding it — if that object is
short-lived (e.g. a per-request handler), an unbounded list dies with it anyway, capping the
damage. A static field lives as long as the classloader, effectively the whole
application — an unbounded static list is the single most common real-world Java leak
pattern, because nothing ever makes the containing "object" unreachable to take the list down
with it.
Rule of thumb: local by default; class-level field only with a stated bound; static field
only with a bound you're very sure about.
Related
- Agrona's Agent Pattern, Explained — the
Agent/AgentRunner/IdleStrategyplumbing this whole demo is built on. - GC Deep Dive: Leak to OOM — the failure case this page contrasts against.
- GC Basics, Visually — the Eden/Survivor/Old vocabulary this page puts into practice with a real log.